Postdot vs Postiz: 83 MiB vs 2,303 MiB at idle
We measured two self-hosted social media schedulers across three fresh installations each. Here is where the memory goes.
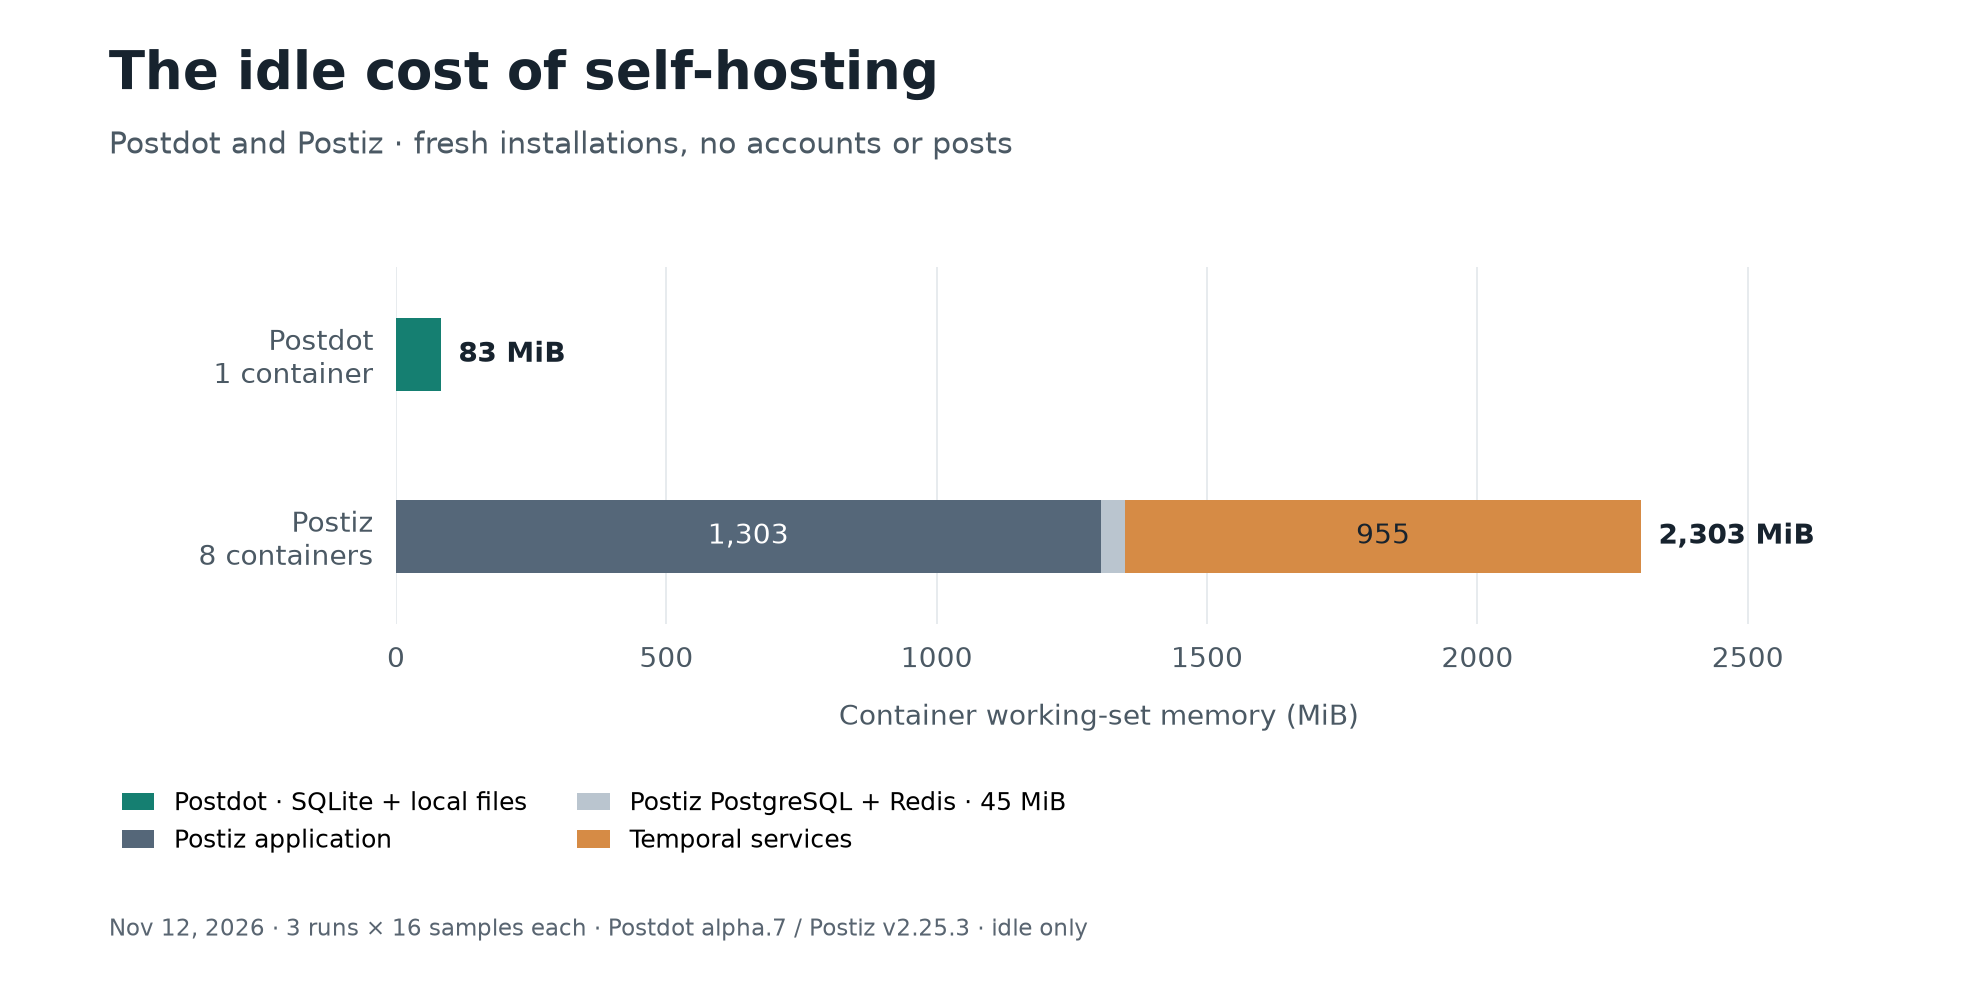
On November 12, 2026, we measured the idle memory of Postdot and Postiz across three fresh installations each. Postdot used 83 MiB. Postiz's official Docker Compose deployment used 2,303 MiB on the same machine, before either had an account or a post.
We build Postdot to fit alongside the tools you already host. Its web app, API, scheduler and publication worker share one container. For this test, we chose SQLite for the database and local files for media, so the installation needed no other services.
If you run several applications on the same server, you already know how their memory adds up. A scheduler spends time waiting for the next publication, and its idle footprint occupies capacity throughout that wait.
One container versus eight
Both installations included their storage and supporting services. For Postdot, that meant one container with a persistent volume. For Postiz, we used the services supplied by its official Compose configuration.
| Installation | Running containers | Mean idle memory | Range of run means |
|---|---|---|---|
| Postdot 0.1.0-alpha.7, SQLite and local files | 1 | 83 MiB | 82.9–83.9 MiB |
| Postiz v2.25.3, official Compose deployment | 8 | 2,303 MiB | 2,296–2,308 MiB |
Postiz's complete deployment held about 28 times as much memory at idle. Before connecting a publishing account, it occupied over 2,200 MiB more of the server's RAM.
Where the memory goes
The Postiz Compose setup we tested ran the application alongside PostgreSQL, Redis and Temporal. Temporal brought its own PostgreSQL database, Elasticsearch, a web interface and administration tools, for a total of eight running containers.
| Postiz component | Mean idle memory |
|---|---|
| Application container | 1,303 MiB |
| Application PostgreSQL and Redis | 45 MiB |
| Temporal services, including their database and Elasticsearch | 955 MiB |
| Complete deployment | 2,303 MiB |
The application accounted for more than half the total. Temporal and its supporting services accounted for most of the rest. The application's PostgreSQL and Redis instances together used 45 MiB.
The application containers alone used 1,303 MiB against 83 MiB, a difference of about 16 to one. Much of the gap remained within the application itself.
If you already run PostgreSQL, Redis and Temporal, Postiz lets you connect to those services instead of deploying the bundled instances. The breakdown shows which parts of the measured installation you would be sharing.
A smaller stack changes what you have to operate
With the configuration we measured, you deploy Postdot, mount a volume and back up the database and media stored there. You have one application service to update and inspect when something goes wrong. You can add it alongside your other tools without setting up a cache or workflow platform for it.
Choose SQLite or PostgreSQL for application data, and local files or S3-compatible storage for media. The two choices are independent: you can use SQLite with S3 or PostgreSQL with local media, through the same Postdot image. The transfer tools let you move the database or media when you change your setup. For this test, we kept both on the server with SQLite and local files.
What you get in that Postdot container
In Studio, Postdot's web app, you write a publication and adapt its text, media and schedule for each destination. Automated and manual channels share the calendar, so you can keep a post you will publish yourself alongside the ones Postdot sends for you.
The CLI, HTTP API and MCP interface give scripts and agents access to the same publishing workflow. You can prepare posts with an agent and review them in Studio, or work from the web app throughout. The scheduler and publication worker run in the same service either way.
How we measured it
We ran the tests on November 12, 2026, on an AMD Ryzen 7 5800X workstation with 32 GB RAM and Docker 29.9.3. No other containers were running during the repeated tests. Both applications used released images pinned by digest.
For each of three runs per product, we started with fresh data volumes. We waited for
readiness, then allowed 240 seconds for Postiz to settle and 60 seconds for Postdot.
We collected 16 docker stats --no-stream samples per container, with a 15-second
sleep between sampling commands. We calculated each run's mean, then averaged the
three run means. The table rounds the overall means to whole MiB.
For Postiz, we used the official Compose configuration with its application image pinned to v2.25.3 and a generated JWT secret. For Postdot, we used 0.1.0-alpha.7 with SQLite, local media and error-level logging. No users, connected channels or publications existed in either installation.
The figures describe idle container working-set memory for these versions and configurations.
Data and scripts: measurement report and image digests, sampling script, run script, and raw data and deployment notes.
Try Postdot on your own server
To run Postdot alongside your other tools, follow the Docker Compose installation guide, connect your channels and prepare your first publication in Studio.
For the broader product comparison, read Postdot vs Postiz.